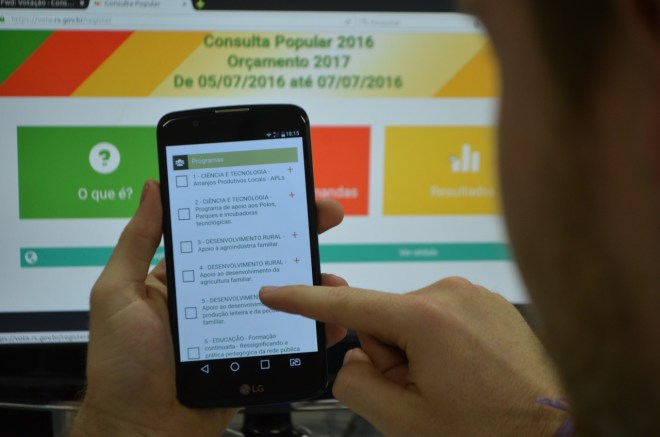
Voting in Rio Grande do Sul’s Participatory Budgeting (picture by Anderson Lopes)
Here are two new published papers that my colleagues Jon Mellon, Fredrik Sjoberg and myself have been working on.
The first, The Effect of Bureaucratic Responsiveness on Citizen Participation, published in Public Administration Review, is – to our knowledge – the first study to quantitatively assess at the individual level the often-assumed effect of government responsiveness on citizen engagement. It also describes an example of how the data provided through digital platforms may be leveraged to better understand participatory behavior. This is the fruit of a research collaboration with MySociety, to whom we are extremely thankful.
Below is the abstract:
What effect does bureaucratic responsiveness have on citizen participation? Since the 1940s, attitudinal measures of perceived efficacy have been used to explain participation. The authors develop a “calculus of participation” that incorporates objective efficacy—the extent to which an individual’s participation actually has an impact—and test the model against behavioral data from the online application Fix My Street (n = 399,364). A successful first experience using Fix My Street is associated with a 57 percent increase in the probability of an individual submitting a second report, and the experience of bureaucratic responsiveness to the first report submitted has predictive power over all future report submissions. The findings highlight the importance of responsiveness for fostering an active citizenry while demonstrating the value of incidentally collected data to examine participatory behavior at the individual level.
An earlier, ungated version of the paper can be found here.
The second paper, Does Online Voting Change the Outcome? Evidence from a Multi-mode Public Policy Referendum, has just been published in Electoral Studies. In an earlier JITP paper (ungated here) looking at Rio Grande do Sul State’s Participatory Budgeting – the world’s largest – we show that, when compared to offline voting, online voting tends to attract participants who are younger, male, of higher income and educational attainment, and more frequent social media users. Yet, one question remained: does the inclusion of new participants in the process with a different profile change the outcomes of the process (i.e. which projects are selected)? Below is the abstract of the paper.
Do online and offline voters differ in terms of policy preferences? The growth of Internet voting in recent years has opened up new channels of participation. Whether or not political outcomes change as a consequence of new modes of voting is an open question. Here we analyze all the votes cast both offline (n = 5.7 million) and online (n = 1.3 million) and compare the actual vote choices in a public policy referendum, the world’s largest participatory budgeting process, in Rio Grande do Sul in June 2014. In addition to examining aggregate outcomes, we also conducted two surveys to better understand the demographic profiles of who chooses to vote online and offline. We find that policy preferences of online and offline voters are no different, even though our data suggest important demographic differences between offline and online voters.
The extent to which these findings are transferable to other PB processes that combine online and offline voting remains an empirical question. In the meantime, nonetheless, these findings suggest a more nuanced view of the potential effects of digital channels as a supplementary means of engagement in participatory processes. I hope to share an ungated version of the paper in the coming days.


